Topography data component
The Topography data component, pymt_topography, is a Python Modeling Toolkit (pymt) library for fetching and caching land elevation data using the OpenTopography REST API.
Access to the following global raster datasets is provided:
SRTMGL3 (SRTM GL3 90m)
SRTMGL1 (SRTM GL1 30m)
SRTMGL1_E (SRTM GL1 Ellipsoidal 30m)
AW3D30 (ALOS World 3D 30m)
AW3D30_E (ALOS World 3D Ellipsoidal, 30m)
SRTM15Plus (Global Bathymetry SRTM15+ V2.1)
NASADEM (NASADEM Global DEM)
COP30 (Copernicus Global DSM 30m)
COP90 (Copernicus Global DSM 90m)
The pymt_topography component provides BMI-mediated access to land elevation data as a service, allowing it to be coupled in pymt with other data or model components that expose a BMI.
Installation
pymt, and components that run within it, are distributed through Anaconda and the conda package manager. Instructions for installing Anaconda can be found on their website. In particular, pymt components are available through the community-led conda-forge organization.
Install the pymt and pymt_topography packages in a new environment with:
$ conda create -n pymt -c conda-forge python=3 pymt pymt_topography
$ conda activate pymt
conda automatically resolves and installs any required dependencies.
Use
The pymt_topography data component is designed to access SRTM land elevation data, with the user providing the dataset type, a latitude-longiture bounding box, and the output file format for the desired data. This information can be provided through a configuration file or specified through parameters.
With a configuration file
The pymt_topography configuration file is a YAML file
containing keys that map to parameter names.
An example is bmi-topography.yaml:
bmi-topography:
  dem_type: SRTMGL3
  south: 36.738884
  north: 38.091337
  west: -120.168457
  east: -118.465576
  output_format: GTiff
  cache_dir: "~/.bmi_topography"
Download this file
for use in the following example.
Start by importing the Topography class from pymt.
from pymt.models import Topography
Create an instance of Topography and initialize it with our configuration file. (This may take a moment to complete as data are fetched from the internet.)
m = Topography()
m.initialize("bmi-topography.yaml")
Note that the configurtation information has been read from the configuration file into the component as parameters.
for param in m.parameters:
    print(param)
('dem_type', 'SRTMGL3')
('south', 36.738884)
('north', 38.091337)
('west', -120.168457)
('east', -118.465576)
('output_format', 'GTiff')
('cache_dir', '~/.bmi_topography')
Also note that the data have been downloaded to the cache directory:
ls ~/.bmi_topography
SRTMGL3_36.738884_-120.168457_38.091337_-118.465576.tif
What variables can be accessed from this component?
for var in m.output_var_names:
    print(var)
land_surface__elevation
What is the highest elevation in the dataset?
import numpy

numpy.max(m.var["land_surface__elevation"].data)
4291
What are the units of this elevation value?
m.var["land_surface__elevation"].units
'meters'
Finish by finalizing the component.
m.finalize()
With parameters
Configuration information can also be passed directly to pymt_topography as parameters.
Start by importing the Topography class from pymt and creating an
instance.
from pymt.models import Topography
m = Topography()
Next, use the setup method to assign values to the parameters needed by Topography.
args = m.setup(
    "datadir-0",
    dem_type="SRTMGL3",
    south=39.75,
    north=40.25,
    west=-105.25,
    east=-104.75,
    output_format="GTiff",
    cache_dir=".",
)
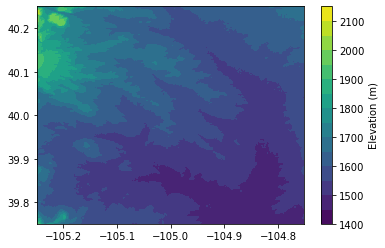
These coordinates represent an area around Boulder, Colorado.
Pass the results from setup into the initialize method. (This step may take a moment as data are fetched from the internet.)
m.initialize(*args)
Note that the parameters have been correctly assigned in the component:
for param in m.parameters:
    print(param)
('dem_type', 'SRTMGL3')
('south', 39.75)
('north', 40.25)
('west', -105.25)
('east', -104.75)
('output_format', 'GTiff')
('cache_dir', '.')
As in the previous example, get the elevation values.
elevation = m.var["land_surface__elevation"]
elevation_values = elevation.data
To make this example a little more interesting, let’s visualize these elevations.
The pymt_topography component contains not only data values, but also the grid on which they’re located. Start by getting the identifier for the grid used for the elevation data.
gid = m.var_grid("land_surface__elevation")
Using the grid identifier, we can get the grid dimensions, origin, and node spacing.
shape = m.grid_shape(gid)
origin = m.grid_origin(gid)
spacing = m.grid_spacing(gid)
print("shape:", shape)
print("origin:", origin)
print("spacing:", spacing)
shape: [600 600]
origin: [  39.75083333 -105.25      ]
spacing: [ 0.00083333  0.00083333]
From these values, we can construct latitude and longitude vectors.
import numpy as np

lat = np.arange(shape[0])*spacing[0] + origin[0]
lon = np.arange(shape[1])*spacing[1] + origin[1]
We’re almost ready to make a plot. Note, however, that the default
behavior of pymt components is to flatten data arrays.
elevation_values.shape
(360000,)
Make a new variable that restores the dimensionality of the data.
elevation_values_2D = elevation_values.reshape(shape)
elevation_values_2D.shape
(600, 600)
Make a simple filled contour plot of the data with a colorbar.
import matplotlib.pyplot as plt

plt.contourf(lon, lat, elevation_values_2D, 15)
plt.colorbar(label="Elevation (m)")
<matplotlib.colorbar.Colorbar at 0x1a9cd5670>
Complete the example by finalizing the component.
m.finalize()
API documentation
Looking for information on a particular function, class, or method? This part of the documentation is for you.